Global Investment Pulse
  • Investing
  • Stock
  • Business
  • Politics
Stock

Performance Profile Paints Different Pictures for Commodity and Equity ETFs

by admin March 28, 2025
March 28, 2025

The performance profile for 2025 says a lot about the state of the market. Commodity-related ETFs are leading, non-cyclical equity ETFs are holding up the best and cyclical names are performing the worst. Clearly, this is not a positive picture for the stock market. This report will show how to interpret the performance profile and separate the leaders from the laggards using a ChartList.

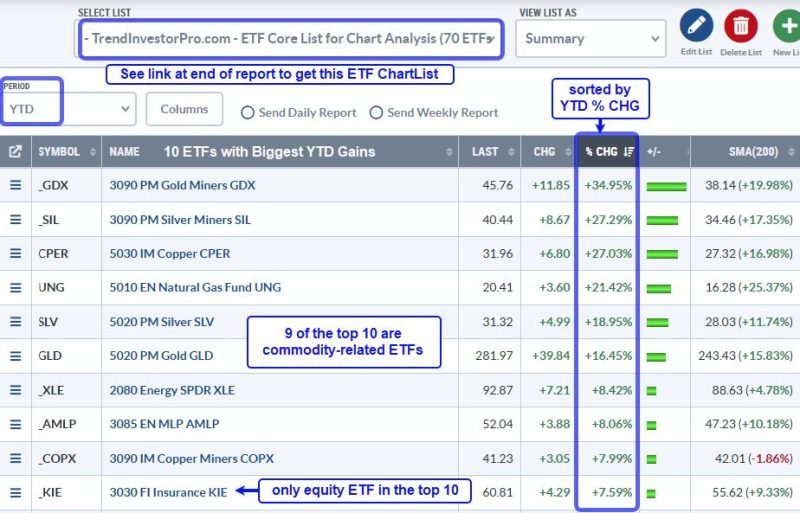
The following images come from the summary view of the TrendInvestorPro core ETF ChartList, which has 72 ETFs covering equities, commodities, bonds and crypto. The period setting is year-to-date (YTD) with the first example sorted by the year-to-date percentage change (% CHG) to see the leaders at the top. I added the SMA(200) column to see how far above/below each ETF is from its 200-day SMA. There are three performance takeaways.

First takeaway: commodity ETFs are leading. The image below shows the 10 ETFs with the highest year-to-date gains. Nine of the top ten are commodity-related ETFs. We are seeing strength in precious metals (gold, silver), industrial metals (copper, copper miners) and integrated energy (XLE). Broady speaking, this tells us that commodities are preferred over stocks. 

TrendInvestorPro covered the leading equity and commodity ETFs in our reports/videos this week. We saw breakouts in Aerospace-Defense and continued leadership in Insurance. Gold has blue skies as it trades near all-time highs, while Copper is looking dicey as it goes parabolic. Click here to take a trial and get immediate access.

Second takeaway: Equity ETFs from non-cyclical groups show relative strength. These include Aerospace-Defense (ITA), Insurance (KIE), Healthcare (XLV), Telecom (IYZ) and MLPs (AMLP). Non-cyclical groups are more insulated from economic fluctuations and often hold up better during periods of economic uncertainty.

Third takeaway: Equity ETFs from cyclical groups show the most pronounced downtrends. The example below is sorted by percent above 200-day SMA. The furthest below their 200-day SMAs are at the top and showing the most pronounced downtrends. Here we see ETFs related to Housing (ITB, XHB), Retail (XRT) and Semiconductors (SMH, SOXX). This is not the performance profile of a bull market. 

Need an organized and focused ETF ChartList that covers all bases? Our Core ETF ChartList has 72 names organized in a logical top-down manner. It includes 59 equity ETFs, 4 Treasury bond ETFs, 7 commodity ETFs and 2 crypto ETFs. Sign up for a trial at TrendInvestorPro and I will share this ChartList.

/////////////////////////////////////////////

previous post
Joe Cavatoni: Gold Shining, Risk Assets Under Pressure — What’s Next?
next post
FCC is investigating Disney and ABC for DEI initiatives

You may also like

The Best Five Sectors, #19

May 19, 2025

Emerging Stocks to Watch – Breakouts, Momentum &...

May 19, 2025

S&P 500 Now in Weakest Seasonal Period…Or Is...

May 19, 2025

Emerging Stocks to Watch – Breakouts, Momentum &...

May 18, 2025

S&P 500 Now in Weakest Seasonal Period…Or Is...

May 18, 2025

SPY and QQQ Recapture their 200-day SMAs –...

May 17, 2025

Applying Dow Theory to Today’s Market: Are We...

May 17, 2025

S&P 500 Now in Weakest Seasonal Period…Or Is...

May 17, 2025

The Stock Market’s Comeback: Key Takeaways for Investors

May 17, 2025

Emerging Stocks to Watch – Breakouts, Momentum &...

May 17, 2025

Leave a Comment Cancel Reply

Save my name, email, and website in this browser for the next time I comment.

    Join our mailing list to get access to special deals, promotions, and insider information. Your exclusive benefits await! Enjoy personalized recommendations, first dibs on sales, and members-only content that makes you feel like a true VIP. Sign up now and start saving!


    By opting in you agree to receive emails from us and our affiliates. Your information is secure and your privacy is protected.

    Recent Posts

    • S&P 500 Now in Weakest Seasonal Period…Or Is It?

      May 19, 2025
    • Emerging Stocks to Watch – Breakouts, Momentum & Upgrades!

      May 19, 2025
    • The Best Five Sectors, #19

      May 19, 2025
    • CEO Appointment

      May 19, 2025
    • Feedback of U.S. Department of Defense Award Funding

      May 19, 2025
    • About us
    • Contacts
    • Privacy Policy
    • Terms and Conditions
    • Email Whitelisting

    Disclaimer: globalinvestmentpulse.com, its managers, its employees, and assigns (collectively “The Company”) do not make any guarantee or warranty about what is advertised above. Information provided by this website is for research purposes only and should not be considered as personalized financial advice. The Company is not affiliated with, nor does it receive compensation from, any specific security. The Company is not registered or licensed by any governing body in any jurisdiction to give investing advice or provide investment recommendation. Any investments recommended here should be taken into consideration only after consulting with your investment advisor and after reviewing the prospectus or financial statements of the company.

    Copyright © 2025 globalinvestmentpulse.com | All Rights Reserved

    Global Investment Pulse
    • Investing
    • Stock
    • Business
    • Politics