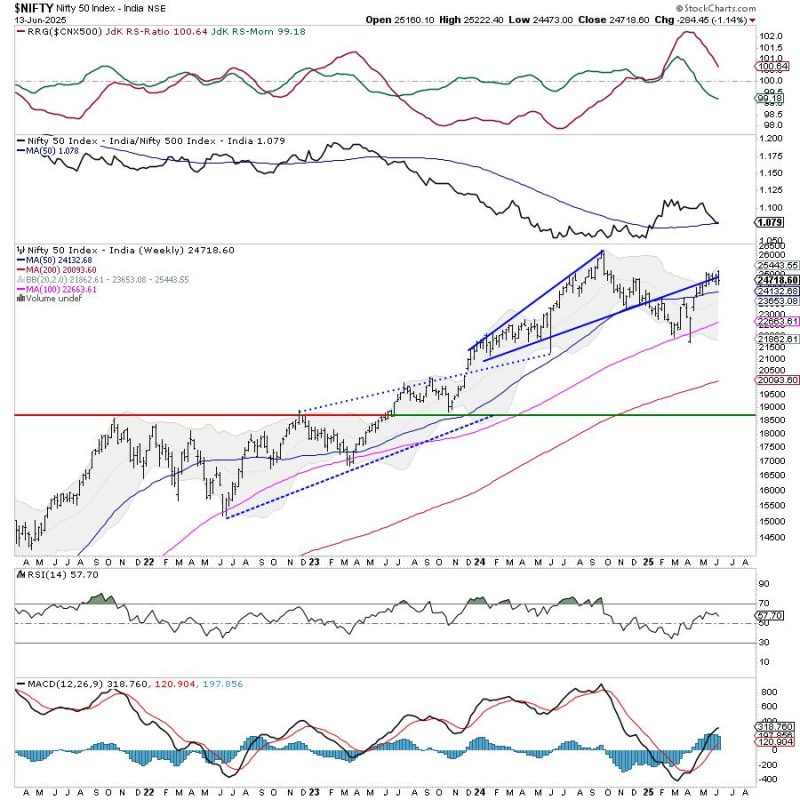
An attempt to break out of a month-long consolidation fizzled out as the Nifty declined and returned inside the trading zone it had created for itself. Over the past five sessions, the markets consolidated just above the upper edge of the trading zone; however, this failed to result in a breakout as the markets suffered a corrective retracement. The trading range stayed wider on anticipated lines; the Index oscillated in a 749-point range over the past week. The volatility rose; the India Vix climbed 3.08% to 15.08 on a weekly basis. The headline Index closed with a net weekly loss of 284.45 points (-1.14%).
We have a fresh set of geopolitical tensions to deal with Israel attacking Iran. The global equity markets are likely to remain affected, and India will be no exception to this. Having said this, the Indian markets are relatively stronger than their peers and are likely to stay that way. Despite the negative reaction to the global uncertainties, Nifty has shown great resilience and has remained in the 24500-25100 trading zone, in which it has been trading for over a month now. There are high possibilities that over the coming week, the Nifty may stay volatile and oscillate in a wide range, but it is unlikely to create any directional bias. A sustainable trend would emerge only after Nifty takes out 25100 on the upside or violates the 24500 level.
The levels of 25100 and 25300 are likely to act as resistance points in the coming week. The supports are likely to come in at 24500 and 24380.
The weekly RSI stands at 57.67; it stays neutral and does not show any divergence against the price. The weekly MACD is bullish and remains above its signal line.
The pattern analysis of the weekly chart shows that the Nifty has failed to break above the rising trendline resistance. This trendline begins from 21150 and joins the subsequent higher bottoms. Besides this, it reinforces the 25100 level as a strong resistance point. For any trending upmove to emerge, it would be crucial for the Index to move past this level convincingly.
Overall, it is unlikely that the Nifty will violate the 24500 levels. The options data shows very negligible call writing below 24500 strikes, increasing the possibility of this level staying defended over the coming days. Unless there is a situation with more gravity to be dealt with, the markets may stay largely in a defined trading range. The sector rotation stays visible in favor of traditionally defensive pockets and low-beta stocks. We continue to recommend a cautious stance as long as the Index does not move past the 25100 level and stays above that point. Until then, a highly stock-specific approach is recommended while guarding profits at higher levels.
Sector Analysis for the coming week
In our look at Relative Rotation Graphs®, we compared various sectors against the CNX500 (NIFTY 500 Index), representing over 95% of the free-float market cap of all the listed stocks.
Relative Rotation Graphs (RRG) show that the Nifty Midcap 100 has rolled inside the leading quadrant and is set to outperform the broader markets relatively. The Nifty PSU Bank and PSE Indices are also inside the leading quadrant; however, they are giving up on their relative momentum.
The Nifty Infrastructure Index has rolled into the weakening quadrant. The Banknifty, Services Sector Index, Consumption, Financial Services, and Commodities Sector Indices are also inside the weakening quadrant. While stock-specific performance may be seen, the collective relative outperformance may diminish.
The Nifty FMCG Index languishes in the lagging quadrant. The Metal and Pharma Indices are also in the lagging quadrant, but they are improving their relative momentum against the broader Nifty 500 Index.
The Nifty Realty, Media, Auto, and Energy Sector Indices are inside the improving quadrant; they may continue improving their relative performance against the broader markets.
Important Note: RRG charts show the relative strength and momentum of a group of stocks. In the above Chart, they show relative performance against NIFTY500 Index (Broader Markets) and should not be used directly as buy or sell signals.
Milan Vaishnav, CMT, MSTA
Consulting Technical Analyst

